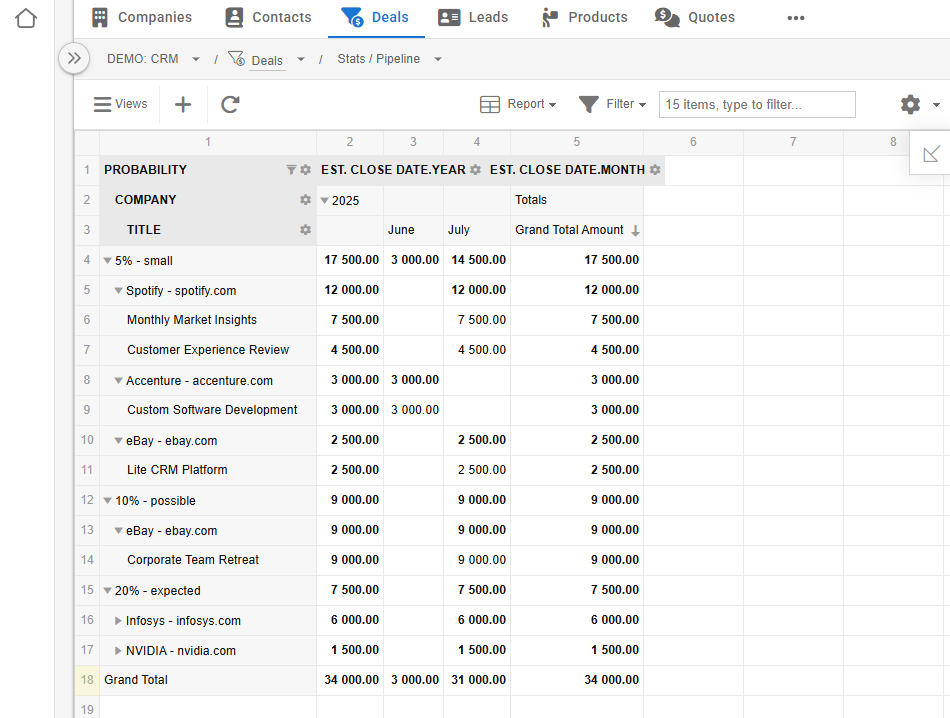
Pivot table report
The pivot table format transforms your app data into summarized reports with grouping, aggregation, and cross-tabulation capabilities without needing external tools.
Real-time reporting
Pivot tables provide instant analysis capabilities:
- Live data - reports update automatically when underlying data changes
- No data export - work directly with your Comind data
- Instant refresh - changes reflect immediately without manual updates
- Filter integration - pivot tables respect your existing list filters
Pivot functionality
Create sophisticated data analysis with:
- Row grouping - organize data by one or more field values
- Column grouping - create cross-tabulated views
- Aggregations - sum, count, average, and other calculations
- Multiple metrics - display several calculated values simultaneously
- Nested grouping - create hierarchical data breakdowns
Benefits over external tools
Built-in pivot tables offer advantages over Excel or BI tools:
- No data copying - work with live, current data
- Permission respect - only see data you have access to
- Integrated workflow - stay within your Comind workspace
- Automatic updates - reports always reflect current state

Use cases
Pivot table format excels for:
- Sales reporting - revenue by region, product, or time period
- Performance analysis - team productivity and KPI tracking
- Financial summaries - budget vs. actual, expense categorization
- Operational metrics - process efficiency and resource utilization
- Trend analysis - patterns over time or across categories
Pivot tables eliminate the need for external reporting tools by providing powerful analysis capabilities directly within your data workspace.